MI3: Data Reconstruction from Historical Visualizations
MI3 is an approach for data reconstruction from historical visualizations that builds on two ideas:
- Data reconstruction tasks can be converted to interactive classification tasks.
- User intervention in interactive classification tasks can be reduced by algorithmic sampling and default labeling.
Below introduce the context and idea in this work. Readers may also refer to our paperopen in new window and codeopen in new window for more details.
Historical Visualizations
History has left us with many wonderful visualization images.
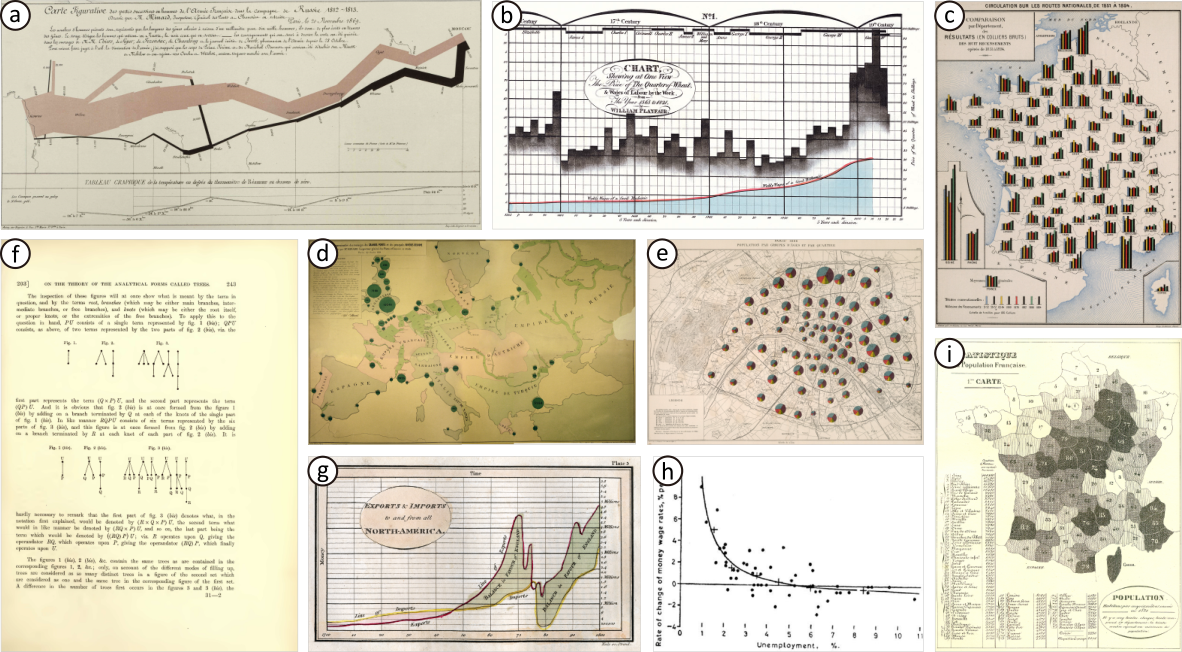
Above shows some of the most well-known historical visualizations, including:
- (a) Charles Minard's movement flow map, 1869[1]
- (b) William Playfair's bar chart, 1822[2]
- (c) Émile Cheysson's thematic map with bar-chart glyphs, 1906[3]
- (d) Charles Minard's bubble map, 1859[4]
- (e) Jacques Bertillon's thematic map with pie-chart glyphs, 1886[5]
- (f) Arthur Cayley's node-link diagram, 1890[6]
- (g) William Playfair's line plot, 1784[7]
- (h) William Phillips's scatter plot, 1958[8]
- (i) Adolphe d'Angeville's choropleth map, 1836[9]
Data Reconstruction
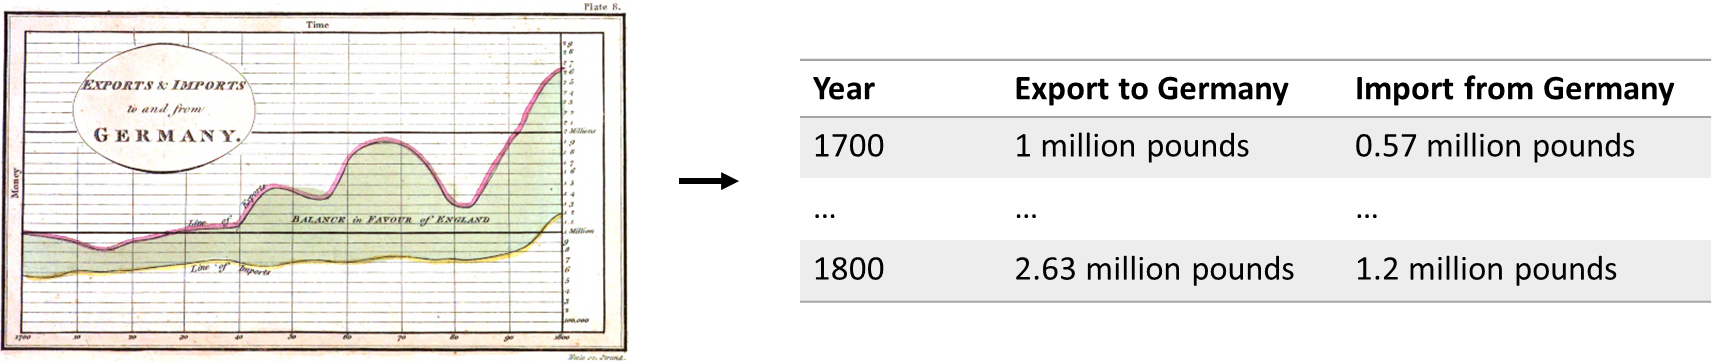
Many historical visualizations capture important statistics of historical events, and therefore are of great interest to scholars in humanities and social sciences. In numerous cases, the original datasets are lost. It is desirable to reconstruct the datasets from the visualization images. Conventionally, reconstructing such datasets requires manually measuring the visual attributes.
The figure above shows an example of reconstructing William Playfair's line plot.
What is MI3?
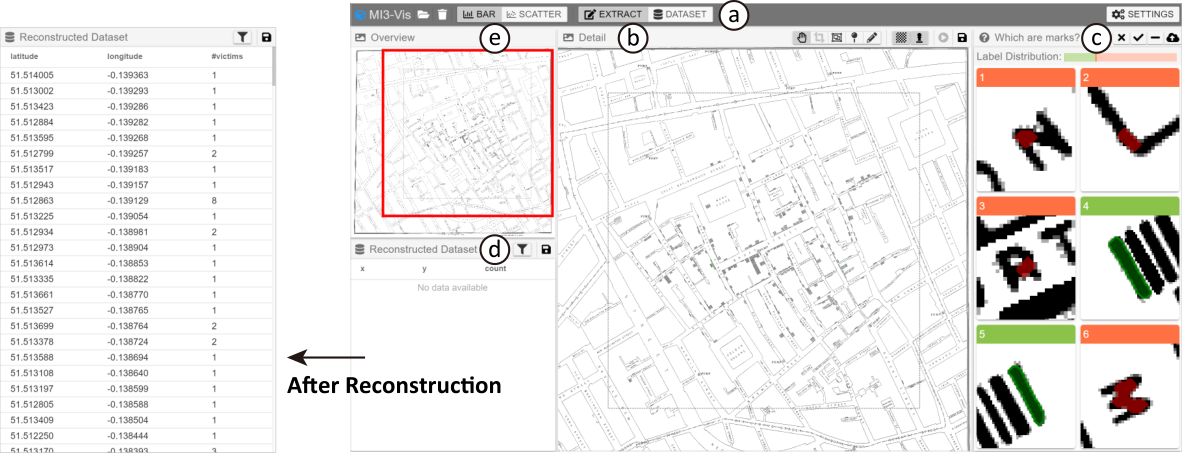
MI3 is a workflow and system for data reconstruction from historical visualization images. MI3 turns the task of data reconstruction from historical visualizations into interactive classification tasks. It uses machine-initiated intelligent interaction that features algorithmic sampling and default labeling to reduce user efforts in interactive classification tasks.
Below is the interface of MI3 where the user can carry out data reconstruction tasks.
Installation
MI3 can be launched with docker with the following commands:
git clone <link-removed-for-anonymity> MI3
cd MI3
docker compose up
2
3
MI3 should then be accessible at localhost:8080 as a web application.
Two Underlying Ideas
Turning Data Reconstruction Tasks into Interactive Classification
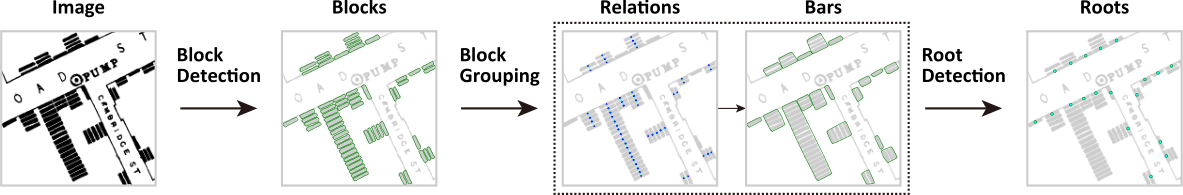
Data reconstruction tasks can be converted to interactive classification tasks. In the figure above, we show an example of turning discrete bar chart data reconstruction into a sequence of three tasks: block detection, block grouping, and root detection. Each of the three tasks can be formulated as a classification task.
Block detection extracts the rectangle glyphs from the image. Block detection can be formulated as algorithmically proposing a collection of visual objects in the image and classifying them as blocks or non-block.
Block grouping groups the detected blocks into discrete bars. Block grouping can be formulated as conceptually building a graph with blocks, with edges denoting blocks that belong to the same discrete bar, and classifying edges as should be connected or not.
Root detection decodes the position information attached to each discrete bar. Root detection can be formulated as proposing feature points in discrete bars, and classifying them as true detections or not.
Such task conversions typically require preprocessing by image processing algorithms. MI3 consists of a collection of image processing algorithms to accommodate the need for detecting different types of visual objects.
Saving Interaction Costs in Interactive Classification
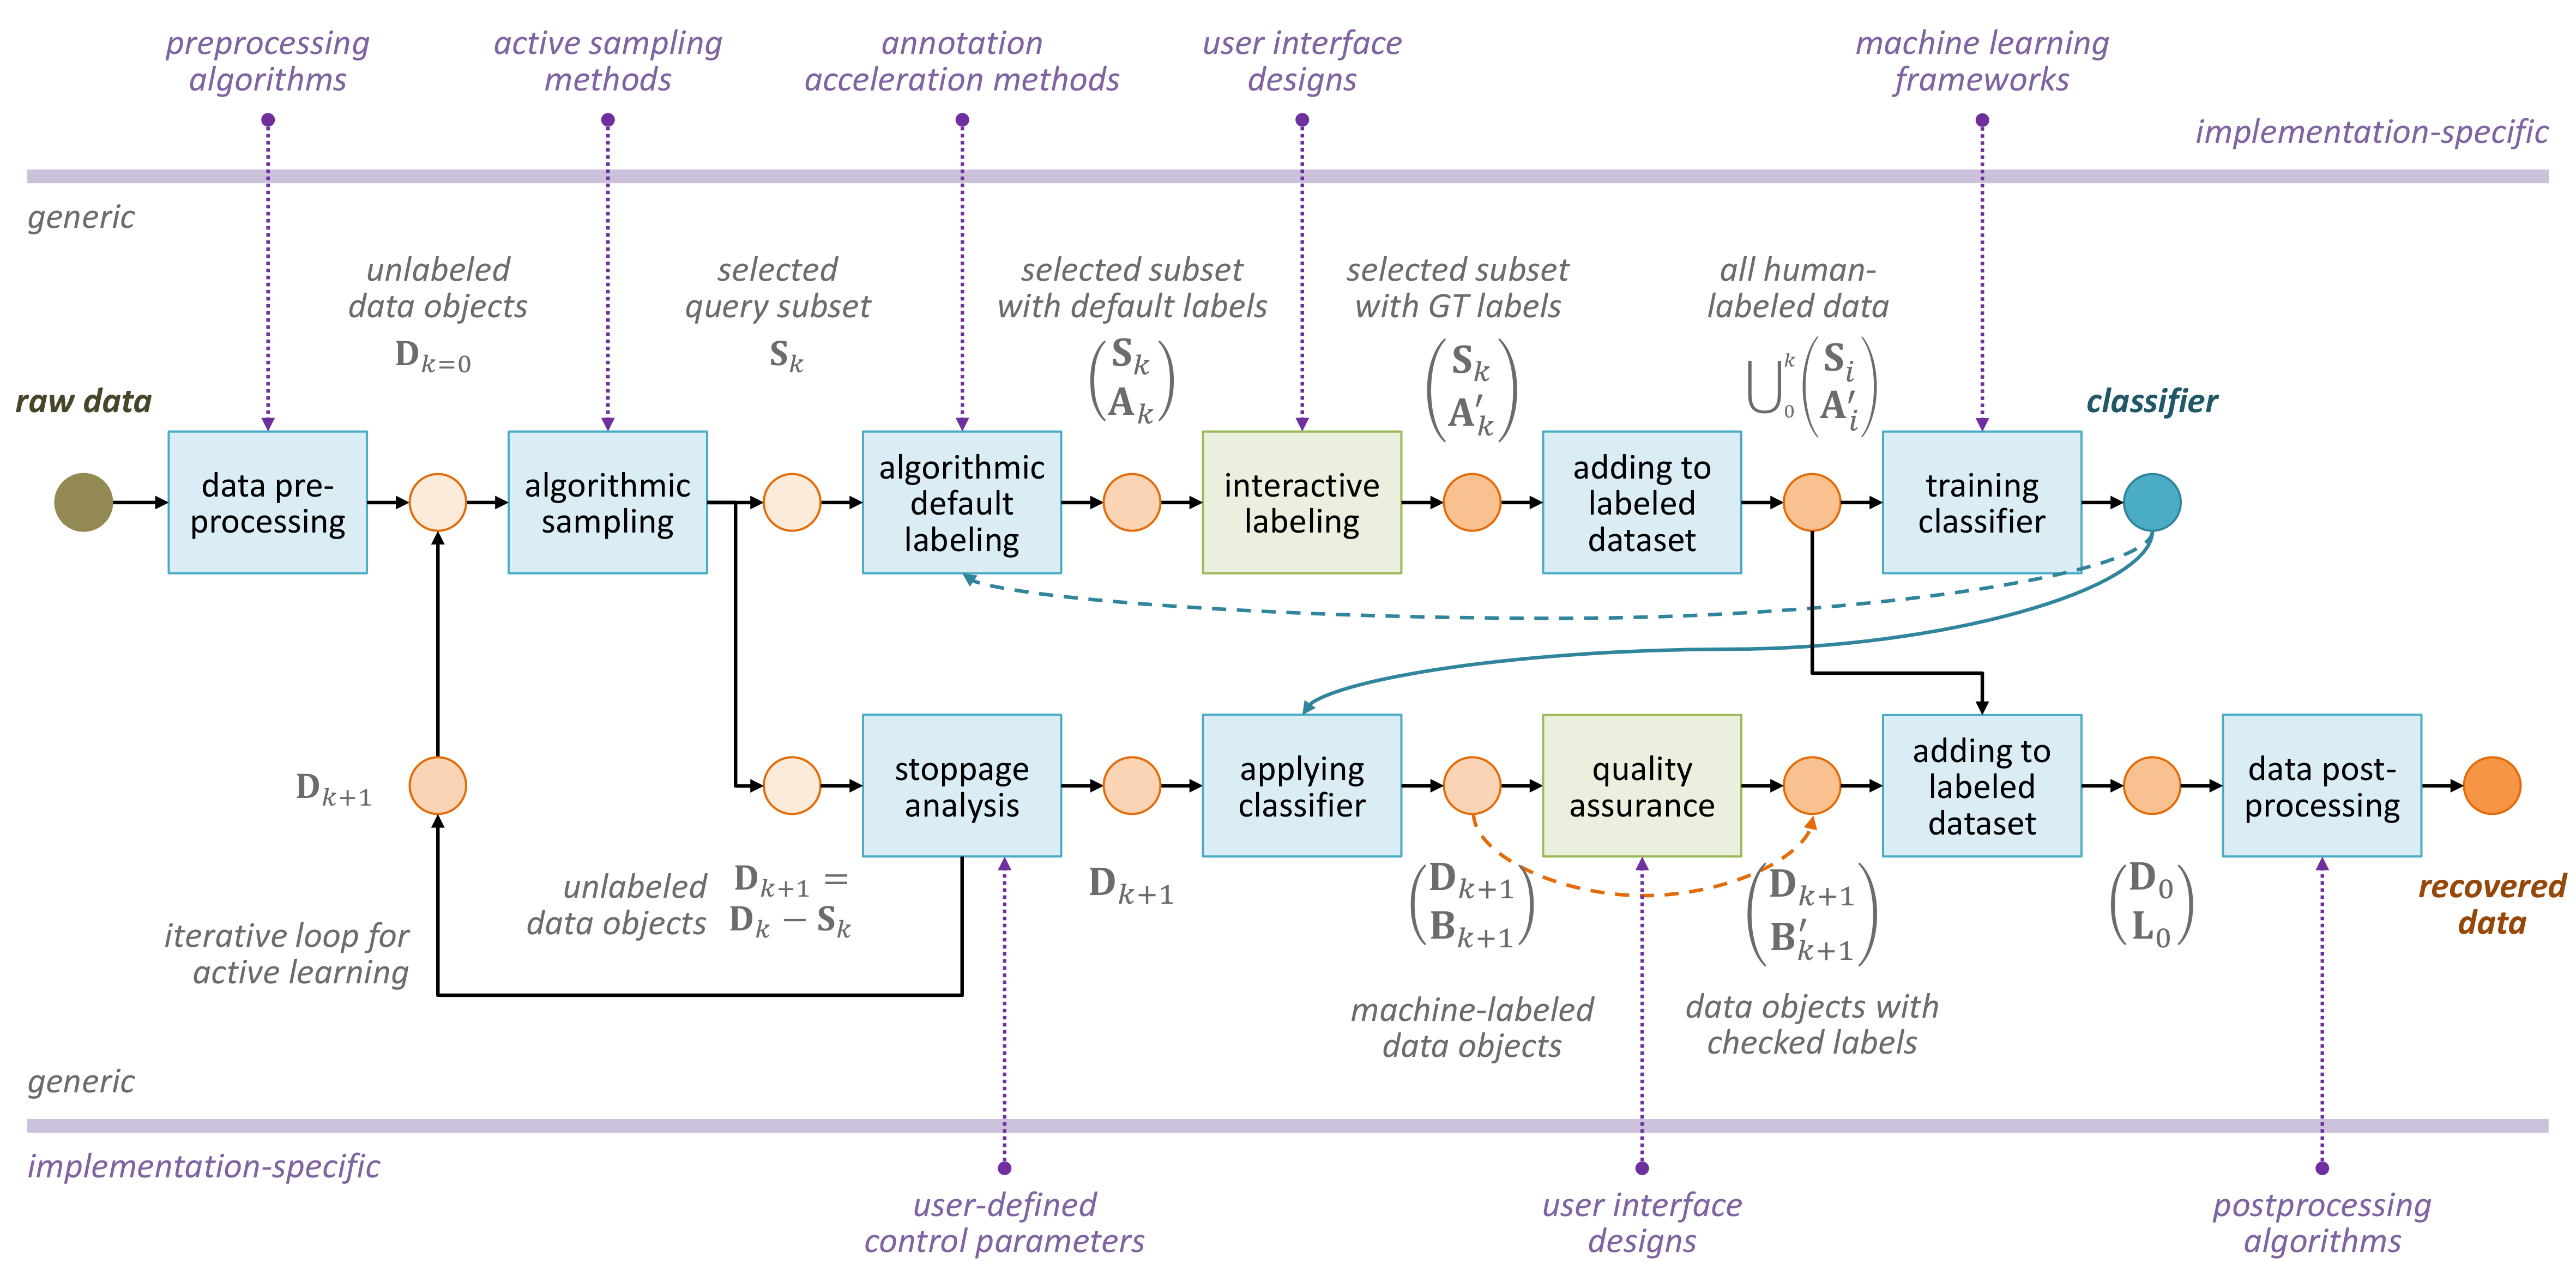
The design goal of MI3 is to perform the data reconstruction task with as few interactions as possible. To this goal, it is based embeds an iterative machine learning framework that features:
- algorithmic sampling for dynamically acquiring labels from the user, and
- default labeling for maximizing the informational value of the user's inputs
Algorithmic sampling selects data objects according to a predefined metric that predicts the potential benefit of labeling a data object to the learning process. Active learning methods, such as uncertainty-based sampling, can be used for algorithmic sampling. In general, any algorithm that can provide an ordering for the data objects may serve the purpose.
Default labeling assigns a default label to each data object when data objects are presented in a user interface for dynamic labeling. Default labeling is supported by models that incrementally learn from the user's input. In this way, the user's input's value is maximized, as it can potentially affect the labeling result for all the unlabeled data objects. If the system can predict some labels correctly, this can reduce the number of interactions that a human user has to perform in labeling the data objects.
Charles Joseph Minard. 1869. Carte figurative des pertes successives en hommes de l’Armée Française dans la campagne de Russie 1812-1813. ↩︎
William Playfair. 1822. Chart Shewing at One View the Price of the Quarter of Wheat & Wages of Labour by the Week from the Year 1565 to 1821. ↩︎
Émile Cheysson. 1906. Circulation sur les Routes Nationales, de 1851 à 1894. ↩︎
Charles Joseph Minard. 1859. Carte Figurative et approximative des tonnages des Grand Ports et des principales Rivières d'Europe. ↩︎
Jacques Bertillon. 1886. Paris 1886 Population par Groupes d'Âges et par Quartier. ↩︎
Arthur Cayley. 1890. The Collected Mathematical Papers of Arthur Cayley, Volume 3. Cambridge University Press ↩︎
William Playfair. 1786. Exports & Imports to and from all North-America. ↩︎
Alban William Housego Phillips. 1958. The Relation between Unemployment and the Rate of Change of Money Wage Rates in the United Kingdom, 1861-1957. Economica 25, 100 (1958), 283–299. ↩︎
Adolphe d'Angeville. 1836. Statistique de la Population Française, Population Habitans par myriametres carries en 1831. ↩︎